ArcGIS Online is a quick simple version of ArcGIS for users to create and share maps of your content. ArcGIS Online is web-based. Users can use the free version for basic functions and licensed version for advanced function.
Learning resource:
ArcGIS Online tutorial: https://learn.arcgis.com/en/projects/get-started-with-arcgis-online/
ArcGIS is a geographic information system (GIS) for working with maps and geographic information. It is used for creating and using maps, compiling geographic data, analyzing mapped information, sharing and discovering geographic information, using maps and geographic information in a range of applications, and managing geographic information in a database.
Access:
Tutorials / Resources
More about ArcGIS features
For a comprehensive guide to ArcGIS, use Lynda.com (GT students have free access to Lynda.com courses)
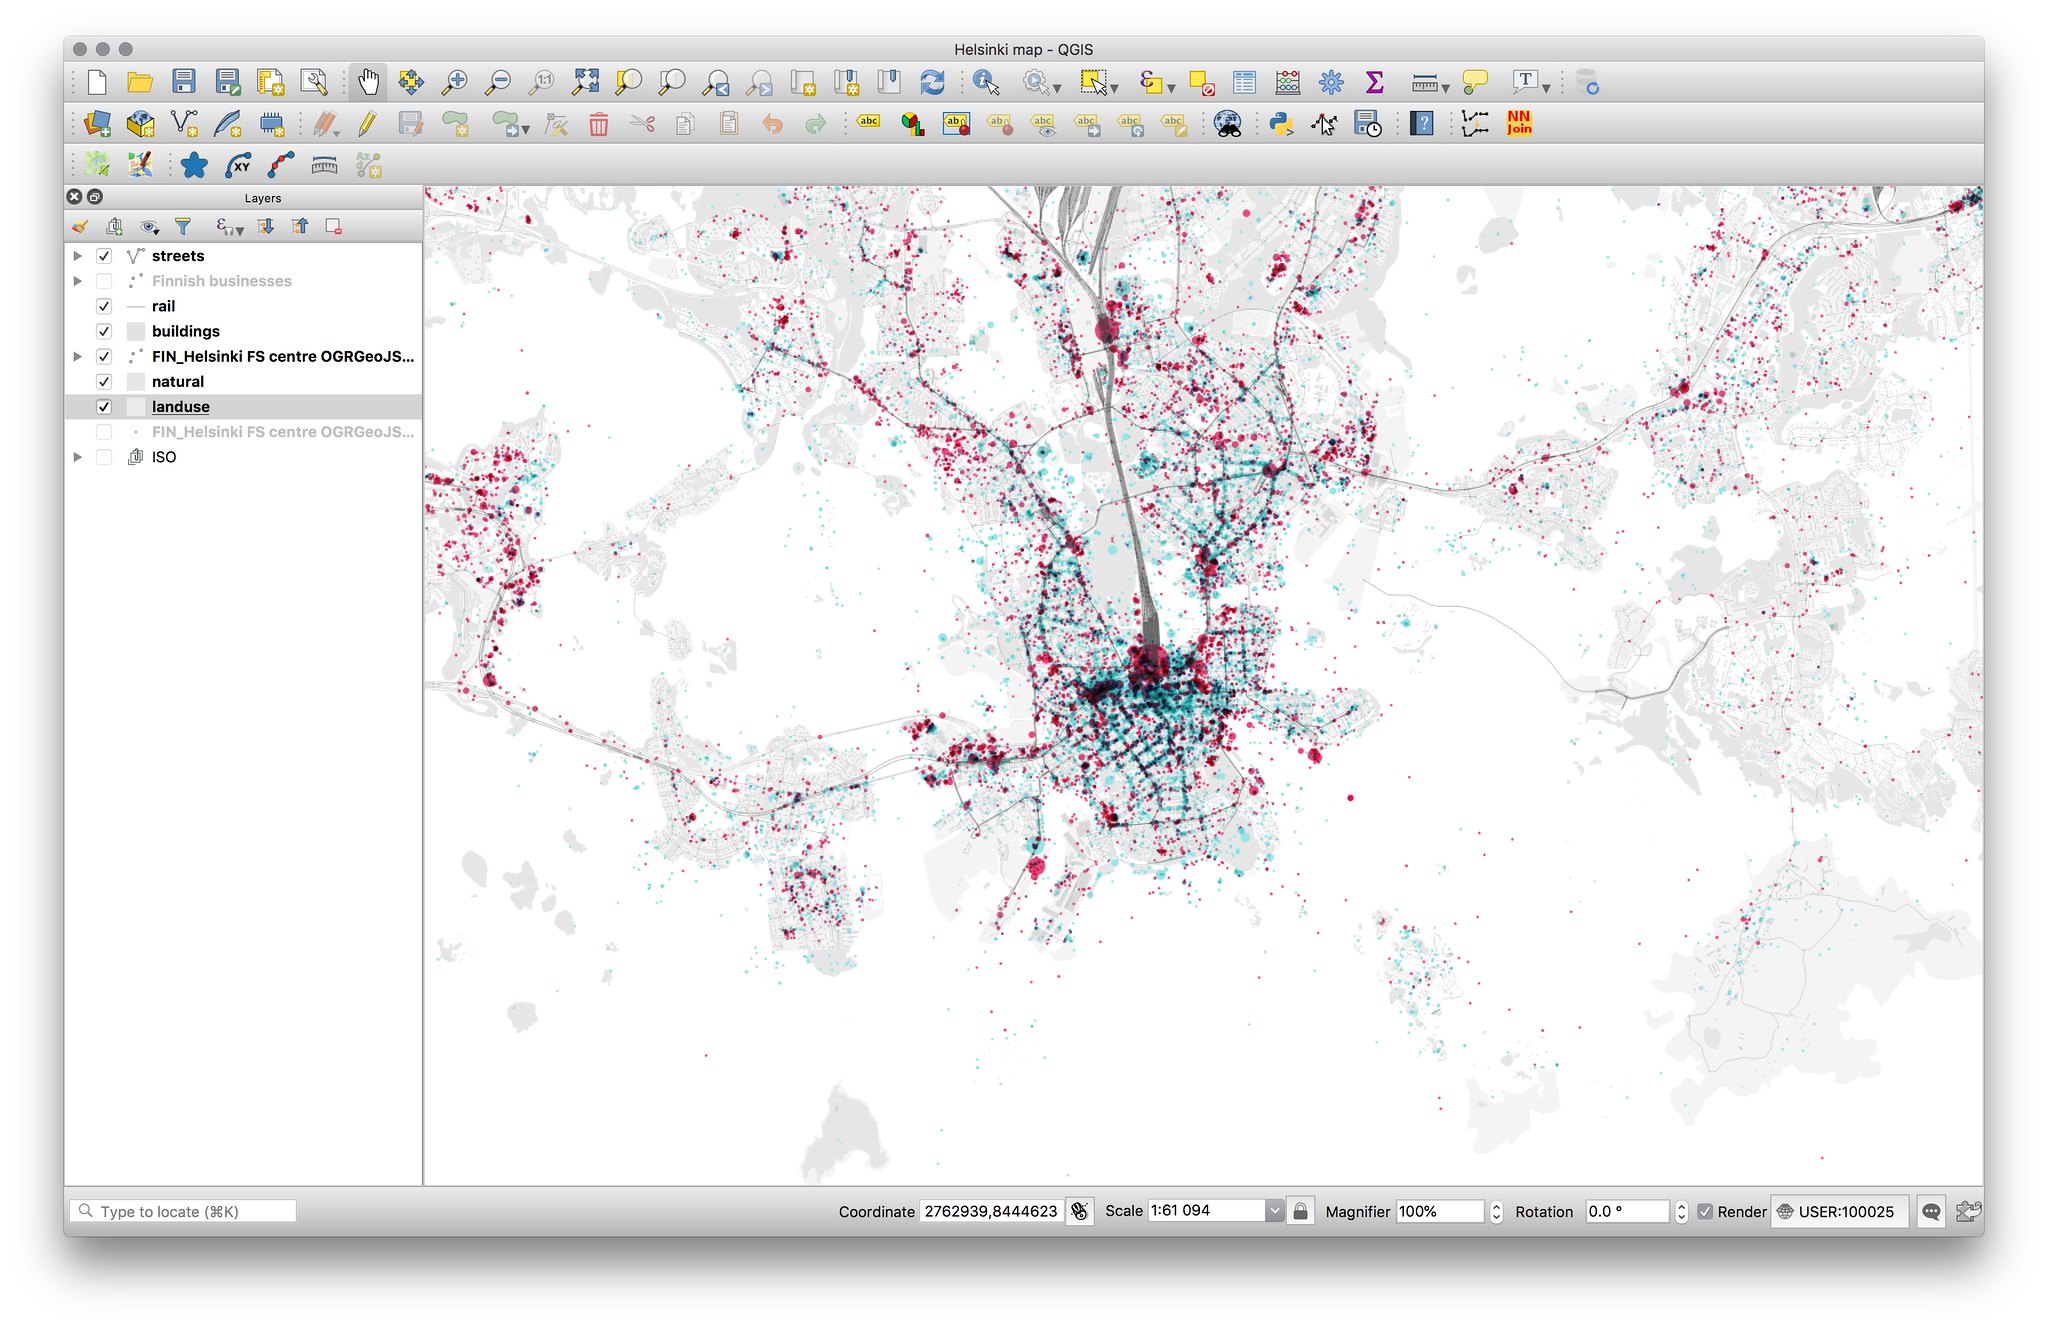
QGIS is a free and open source Geographic Information System (GIS), which allows users to analyze and edit spatial information and also compose and export graphical maps.
QGIS supports both raster and vector layers; vector data is stored as either point, line, or polygon features. Multiple formats of raster images are supported, and the software can georeference images.
QGIS provides many external Python plugins that are provided by the community. These plugins can extend QGIS functionality and help you better view, analyze, and manage your data. QGIS also contains many features such as viewing and analyzing geographical data, publishing maps to the Internet, For a more comprehensive description of QGIS’s features, visit:QGIS user manual
Access:
Download QGIS for free and get started from its website.
More example projects from QGIS Map Examples.
Tutorials / Resources: